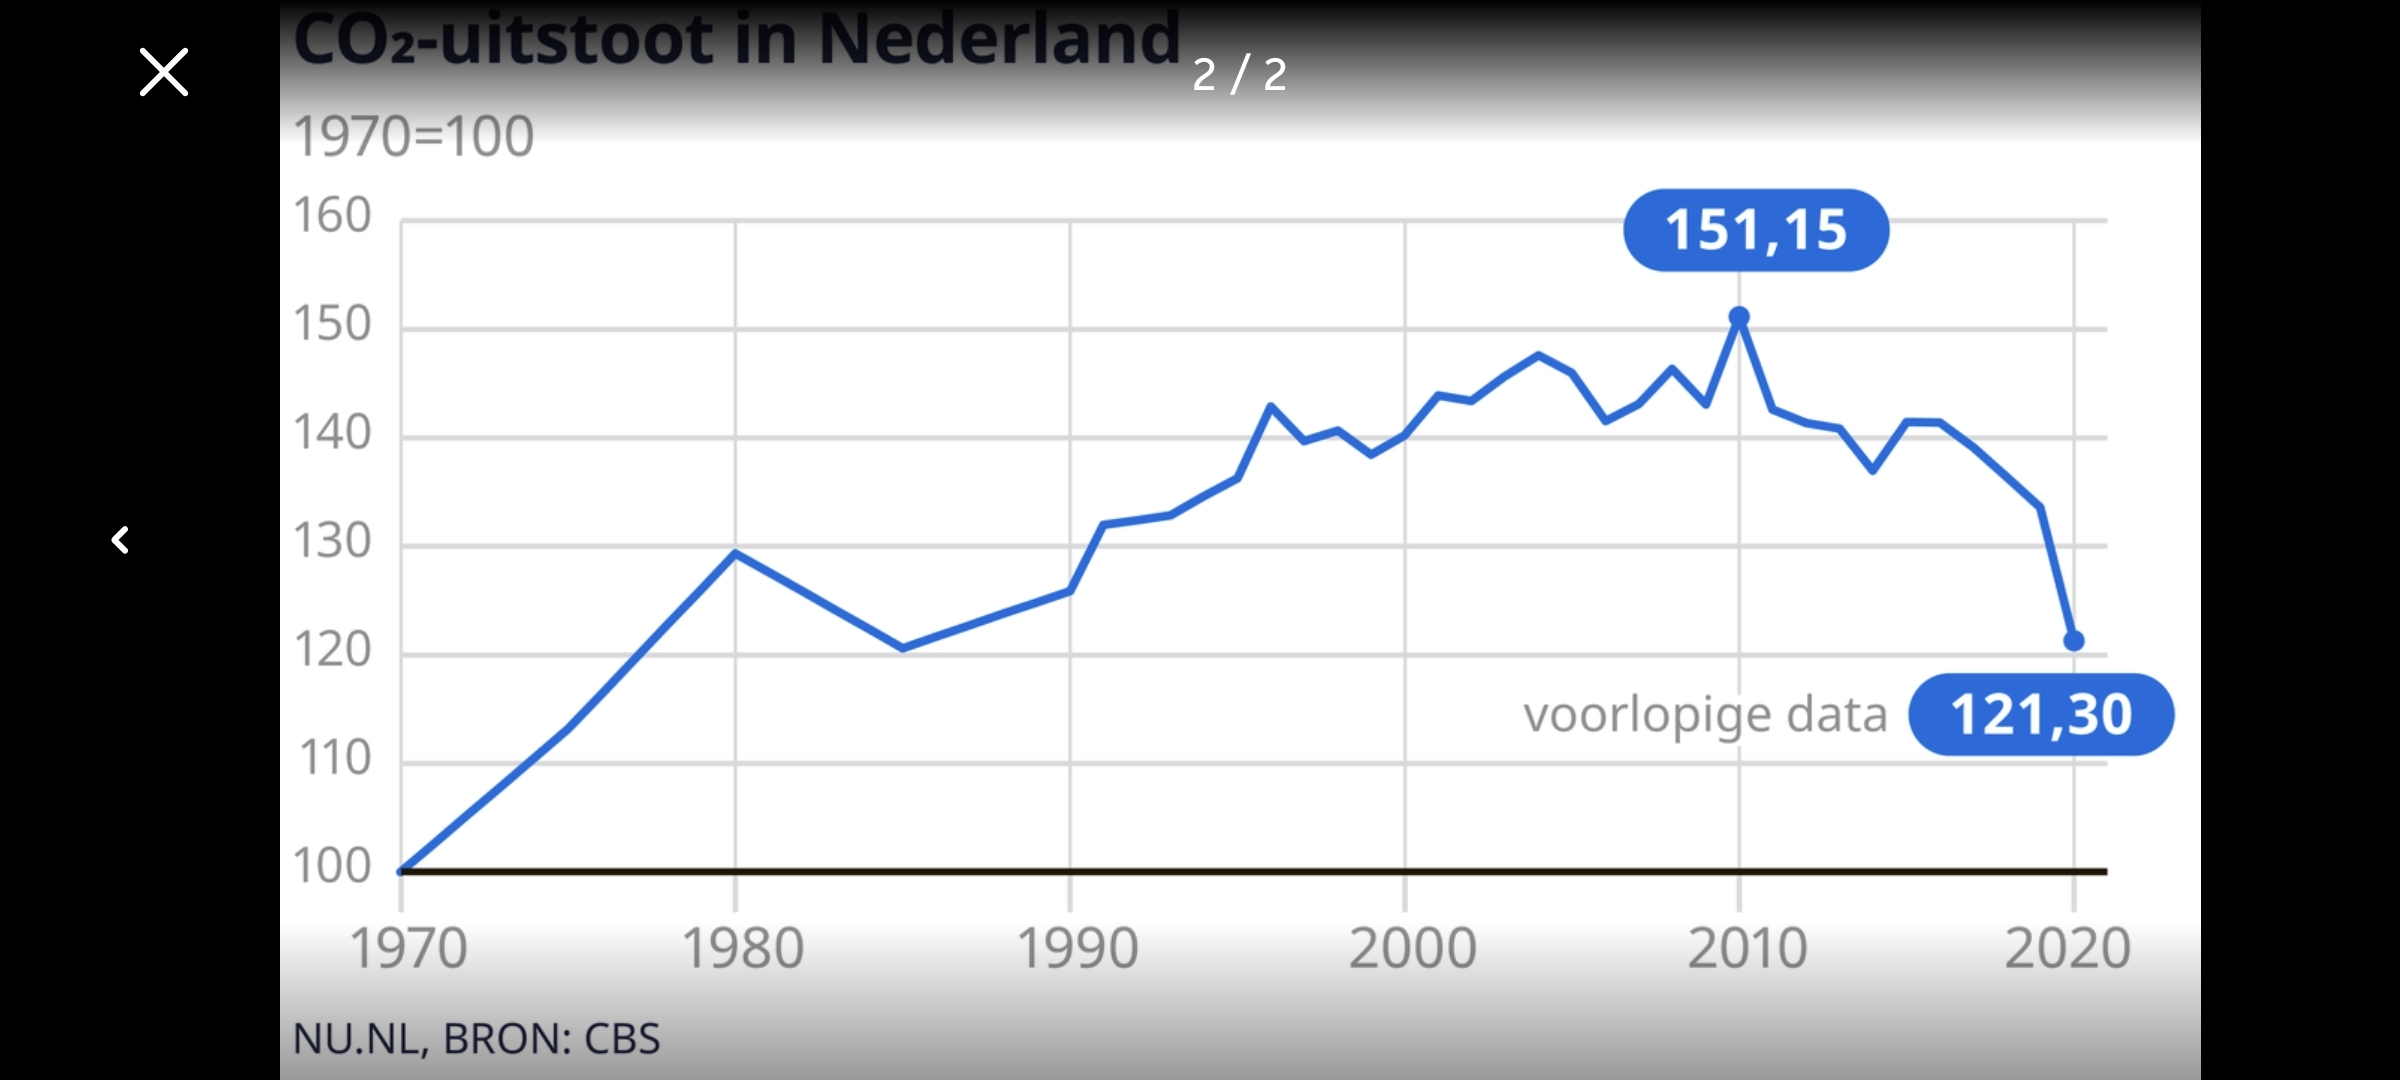
In 2021, total GHG emissions (including indirect CO2 emissions and including emissions from Land use, land use change and forestry (LULUCF)) in the Netherlands amounted to 172 Tg CO2 eq. This is approximately 24.9 percent below the emissions in the base year 1990 (228.9 Tg CO2 eq.).
I’m curious about if the manufacturing industry has decreased since 1990.
Or in other words, how much of this is due to positive change and how much is grandstanding about outsourced pollution.
This is what I am wondering everytime I read such numbers. Reaching any kind of emission goals isn’t worth much, if we in return ship our trash somewhere else or buy more stuff from other countries that dont give a fuck.
Consumption based emissions have also fallen from 13t per capita in 1990 to 9t per capita in 2020.
Reminder: 2021 was not a normal year, due to the pandemic, and emissions have risen again afterwards, IIRC. The trendline is good, but comparing these specific years doesn’t paint the clearest picture.
Any time I see graphs or statistics which cut of at 2020 to 2021 I get the feeling that the trend is being misrepresented, maybe deliberately.
This graph will shed some light on tendencies. The downfall started per 2010 when new policy and new (greener) measures were implemented. 1990 seems to be the year of reference. Note also that the downfall is accompanied by BNP growth iirc.

And also In 2022 the emission of greenhouse gasses was 7,9 percent lower than in 2021. This is mainly due to the high prices of natural gas.
Some good news from Netherlands for a change. The abstract:
Abstract
Total greenhouse gas (GHG) emissions in the Netherlands in 2021 increased by 1.8 percent, in comparison with 2020 emissions. This increase was mainly the result of an increase in natural gas combustion of households due to a relatively cold winter. In 2021, the share of renewable energy is 13 percent of total energy consumption. In 2020, this share was 11.5 percent.
In 2021, total GHG emissions (including indirect CO2 emissions and including emissions from Land use, land use change and forestry (LULUCF)) in the Netherlands amounted to 172 Tg CO2 eq. This is approximately 24.9 percent below the emissions in the base year 1990 (228.9 Tg CO2 eq.).
CO2 emissions in 2021 were 14.8 percent below the level in the base year. The total of the emissions of methane, nitrous oxide and fluorinated gases (CH4, N2O and F-gases) was reduced by 53.7 percent over this period.
This report documents the Netherlands’ annual submission for 2023 of its GHG emissions inventory 1990-2021 in accordance with the 2006 IPCC Guidelines for National Greenhouse Gas Inventories (IPCC, 2006) prescribed by the United Nations Framework Convention on Climate Change (UNFCCC) and the Paris Agreement (PA). The report contributes to fulfilling the reporting requirements under the Governance Regulation of the Energy Union (EU 2018/1999) and implementing regulations.
This report includes explanations of observed trends in emissions, an assessment of the sources with the highest contribution to total national emissions (key sources) and a description of the uncertainty in the emissions estimates. Estimation methods, data sources and emission factors (EFs) are described for each source category, and there is also a description of the quality assurance system and the verification activities performed on the data. The report also describes changes in methodologies since the previous submission (NIR 2022), the results of recalculations and planned improvements.


